An overview of the Music Streaming market in Africa
It’s no secret that the music consumption habits of people have immensly changed in the last decade, especially since the begging of the COVID-19 pandemic. After the illegal distribution of music skyrocketed in the late 90’s, the arrival of the new millenium brought a new life to the music industry. Music Streaming services were born and slowly but surely people got onboard and started willing top pay for a premium service that offered good quality, a healthy catalogue and a seamless user experience.
The African market has been no exception, with an ever-growing number of people interested in paying to stream music. Thanks to the increased internet connection speeds and availability, paired with new and more inclusive payment methods, the Music Streaming segment in Africa has experienced a significant growth in the last five years, going from 12.8 million users in 2017, to 37.8 million in 2022, an impressive 24,2% CAGR. This means that user penetration will settle at 3.1% in 2022 and is expected to hit 4.3% by 2027.
Simultaneously to the number of users, the revenue of the market has incresed year-on-year until reaching $164.3 million in 2022. And… there is no sign of the segment revenue slowing down, with an estimation of an annual growth rate (CAGR 2022-2027) of 8.99%, resulting in a projected market size of $252.7 million by 2027.
Conversion rates maximized through alternative payment methods
In this context, it is important to reflect on how people are paying for Music Streaming services. Considering that Africa has historically been a low banked region, with less than 4% of credit card owners, according to The World Bank, alternative payment methods might be the force that boosts subscriptions in the continent.
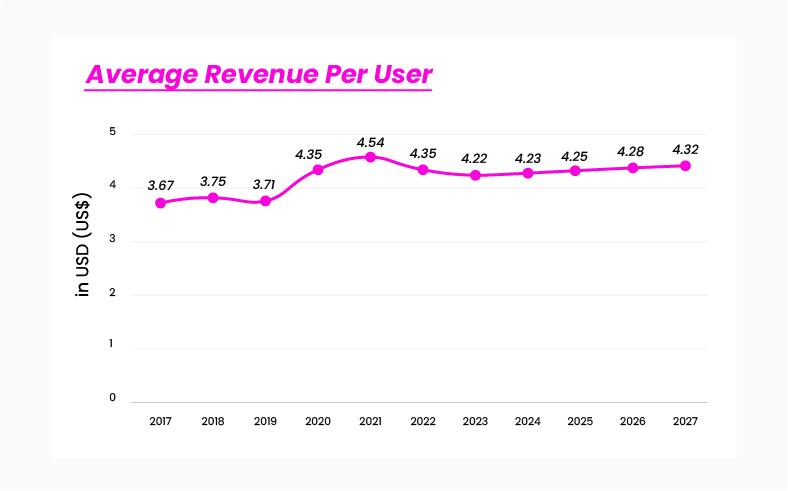
According to the data, the Average Revene Per User (ARPU) is stabalizing after the peak generated with the pandemic, where the spend topped $4.54. The forecast points that in the next 4 years there will be a CAGR of over 0,5%, reaching $4.32, a 16,4% more than in 2019, before the COVID-19 outbreak.
With Mobile Money becoming a major force in the payment ecosystem in Africa ($701.4 billions in value transaction in 2021, according to GSMA) and DCB growing steadily, there is a huge opportunity to address the market with locally adapted payment methods, that suit the needs of the population and offer a secure, fast and easy way top pay for digital services. These alternative payment methods offer higher conversion rates than traditional ones and can help maximize revenue and increse the number of users for Music Streaming services.
Why is localization key in the Music Streaming segment?
When speaking about Music Streaming, localization is key in any given region. But this is especially relevant in Africa, with a strong cultural and linguistic heterogeneity. The knowledge of local regulations, the importance of sourcing and contracting with local artists and the necessity of creating localized advertising and sponsored posts to tackle the market is something that companies should consider for their internationalization.
Through our DV CONTENT service, we have helped services such as Digster, from Universal, to hit the market in a successful way, gathering 13.000.000 subscribers in Morocco, Ivory Coast, Tunisia, Senegal and Cameroon.
If you are curious and want to know more about how we helped Universal deploy their service, contact our team and let them explain you all the details.